...with a BIG bottle. Sadly empty before I ever laid hands on it.
Tuesday, April 17, 2007
Monday, April 02, 2007
Hansel and Gretel
...are aliive and well/And living in Berlin.
We're back on the air, people, without converting to the New Blogger (TM).
Photos from the Napa trip and the visit to the Surgical Museum coming shortly.
We're back on the air, people, without converting to the New Blogger (TM).
Photos from the Napa trip and the visit to the Surgical Museum coming shortly.
Sunday, February 11, 2007
Tuesday, February 06, 2007
Why, Thank You!
It is cold enough for me.
Walking to the bus stop is like entering a Jack London story. I hope the tinder works, or I'll have to gut a dog to warm my hands inside.
Also, my sewage line froze due to global climate change, so I am taking showers in an apartment down the hall. The water lines for the hot tub situated over my apartment froze as well, so I have a plastic tent suspended from my ceiling. It's all very chic in a postapocalyptic sort of way.
Walking to the bus stop is like entering a Jack London story. I hope the tinder works, or I'll have to gut a dog to warm my hands inside.
Also, my sewage line froze due to global climate change, so I am taking showers in an apartment down the hall. The water lines for the hot tub situated over my apartment froze as well, so I have a plastic tent suspended from my ceiling. It's all very chic in a postapocalyptic sort of way.
Friday, January 05, 2007
Wednesday, December 27, 2006
Harold & Maudeland

The thing I love about the Bay Area is that you walk through bits of literature and history. Like the Sutler Baths, which burned down 30-40 years ago, and which were used to shoot a scene in the movie Harold and Maude. Elsewhere, you wander through the land of the Beats in the North Beach neighborhood around City Lights, see the literary ghost of Steve McQueen pitch down Nob Hill streets, and come across the settings of Tales of the City. You end up with a feeling that's the opposite of nostalgia--the feeling that if something happened here, and here, and here, you might be about to step into the middle of a story of your own at any moment.The corollary of this idea, or maybe just its twin, is the sense you get from everyone you talk to that their career is just something to pay the rent; they're really in the middle of the story that's happening right at the moment you're talking to them.
Pacific
San Francisco by Night
Chad invited me to a party at Dan and Donnan's place. Even with the address, the taxi driver couldn't figure out where the party was...he should have just looked for the crowd of guys standing around smoking and looking for something to blog.
As soon as I said hi, the crowd introduced me as "that blogger from Chicago" and themselves as "DanChrisMichaelChrisDaveandNick". They fed me on red wine and chocolate mousse, while Donnan sang holiday songs from Hedwig. Chad showed up just as I was leaving, so unfortunately, we didn't get to chat as much as I'd have liked. Still, I got to meet his cousin Scott, also from Chicago, and a number of SF's most interesting people.
I'd love to say that we all hit the Endup after capturing all their URLs and becoming BFF with each and every one of them, but jet lag got the better of me, and I collapsed until the morning.
As soon as I said hi, the crowd introduced me as "that blogger from Chicago" and themselves as "DanChrisMichaelChrisDaveandNick". They fed me on red wine and chocolate mousse, while Donnan sang holiday songs from Hedwig. Chad showed up just as I was leaving, so unfortunately, we didn't get to chat as much as I'd have liked. Still, I got to meet his cousin Scott, also from Chicago, and a number of SF's most interesting people.
I'd love to say that we all hit the Endup after capturing all their URLs and becoming BFF with each and every one of them, but jet lag got the better of me, and I collapsed until the morning.
Wednesday, December 20, 2006
San Francisco, Day 1
Got up early in the morning after a late night flight to SFO. I decided to charge up the side of Telegraph Hill first thing off the bat, bundled up in a wool sweater, jeans and scarf. Appropriate for Chicago weather, nearly fatal in 58 degree, high humidity San Francisco conditions after going up 45 degree streets. By the time I reached the top, I was completely drenched.
On the way back down, I stopped in Cafe Zoetrope, and told the bartender, "I just climbed Telegraph Hill."
"Yeah," she said, "that's what it looks like."
Later in the day, I stopped in at Mea Cinis ("my ashes"), a newly-opened store that specializes in new hand made jewelry and Southeast Asian Antiquities. The store featured Chad's Venetian plastering job and the hand-strung pigskin hangings that looked like dreadlocks, as well as a kick-ass selection of art objects.
Dan, the owner, showed me around the place. When I mentioned that Chad's blog led me to visit, Dan shouted, and Chad appeared from the back, wearing a Geek Squad t-shirt. He seemed very surprised that anyone reads his blog...false modesty, judging from his site stats.
We started chatting about blogging and plastering and whatnot, and Dan showed me his twin brother's collection of 12th century bronze Khmer mirrors. A guy came in, wearing a massive pair of green galoshes, and started ooh-ing and aah-ing over everything, until he came to the mirrors, and gasped.
"Those are 14th century Khmer bronze mirrors," he said.
"No," replied Dan with a touch of pride, "they're 12th century Khmer bronze mirrors."
Just a standard day in North Beach. Always nice when you can find the one place where two people would come to argue over the dating of nine hundred year old art.
A bald woman came in next. I couldn't tell if she was bbald because of some ailment, or for religious reasons, or just as a fashion statement, but clearly, being bald worked for her. Dan went off to show her the bracelets made from something that looked like the mating between human bone and high-grade fractal rendering software.
Chad said, "look, since you don't know anyone in San Francisco...now you do. A friend of mine is throwing a party tonight, and I'd love it if you would come."
Despite jetlag and tired legs from the morning climb, how could I say no?
On the way back down, I stopped in Cafe Zoetrope, and told the bartender, "I just climbed Telegraph Hill."
"Yeah," she said, "that's what it looks like."
Later in the day, I stopped in at Mea Cinis ("my ashes"), a newly-opened store that specializes in new hand made jewelry and Southeast Asian Antiquities. The store featured Chad's Venetian plastering job and the hand-strung pigskin hangings that looked like dreadlocks, as well as a kick-ass selection of art objects.
Dan, the owner, showed me around the place. When I mentioned that Chad's blog led me to visit, Dan shouted, and Chad appeared from the back, wearing a Geek Squad t-shirt. He seemed very surprised that anyone reads his blog...false modesty, judging from his site stats.
We started chatting about blogging and plastering and whatnot, and Dan showed me his twin brother's collection of 12th century bronze Khmer mirrors. A guy came in, wearing a massive pair of green galoshes, and started ooh-ing and aah-ing over everything, until he came to the mirrors, and gasped.
"Those are 14th century Khmer bronze mirrors," he said.
"No," replied Dan with a touch of pride, "they're 12th century Khmer bronze mirrors."
Just a standard day in North Beach. Always nice when you can find the one place where two people would come to argue over the dating of nine hundred year old art.
A bald woman came in next. I couldn't tell if she was bbald because of some ailment, or for religious reasons, or just as a fashion statement, but clearly, being bald worked for her. Dan went off to show her the bracelets made from something that looked like the mating between human bone and high-grade fractal rendering software.
Chad said, "look, since you don't know anyone in San Francisco...now you do. A friend of mine is throwing a party tonight, and I'd love it if you would come."
Despite jetlag and tired legs from the morning climb, how could I say no?
Sunday, December 17, 2006
Weirdness Roundup
Well, with 2006 nearly done, it's time to bottle up as much of the weirdness as possible before it all floats away.
The 10 most bizarre people on earth (via kottke (via mr) (UPDATED LINK)
Including the guy with the mutated twin lodged in his abdomen and the guy who ate a Cessna. I was briefly disappointed not to be included in this list, but as a friend once told me, "Scott, you're a nice amateur eccentric, but we have professionals here to handle the heavy lifting."
Dominionist Christians in the Pentagon, and the People who Hate Them
A classic political rant. I recommend that y'all give this guy whatever it is he needs to take care of the problem, or we may be living in a Left Behind book in no time flat.
The fugue state of the Bishop of Southwark (via Neil)
And of course, the Russian Spy Polonium Sushi Caper.
As Bruce Sterling likes to say, this one is fractally weird. As the press boys like to say, this one's got legs. This particular little article highlights the victim's dining companion. Nice reading.
The 10 most bizarre people on earth (via kottke (via mr) (UPDATED LINK)
Including the guy with the mutated twin lodged in his abdomen and the guy who ate a Cessna. I was briefly disappointed not to be included in this list, but as a friend once told me, "Scott, you're a nice amateur eccentric, but we have professionals here to handle the heavy lifting."
Dominionist Christians in the Pentagon, and the People who Hate Them
A classic political rant. I recommend that y'all give this guy whatever it is he needs to take care of the problem, or we may be living in a Left Behind book in no time flat.
The fugue state of the Bishop of Southwark (via Neil)
What happened to the Bishop of Southwark last Tuesday night? Was he mugged on the way home to Tooting from a pre-Christmas party at the Irish embassy? Or was he found wandering in a confused state in Crucifix Lane, near his cathedral, having supped not wisely, but too well?
The Rt Rev Tom Butler, 66, one of the Church of England's most senior bishops and a pillar of Thought for the Day on the BBC Today programme, says he has no idea. Others say he was seen sitting in the back of a Mercedes chucking children's toys out of the window and announcing: I'm the Bishop of Southwark. It's what I do."
And of course, the Russian Spy Polonium Sushi Caper.
As Bruce Sterling likes to say, this one is fractally weird. As the press boys like to say, this one's got legs. This particular little article highlights the victim's dining companion. Nice reading.
Wednesday, October 18, 2006
Wednesday, October 04, 2006
Bloody swimming pools

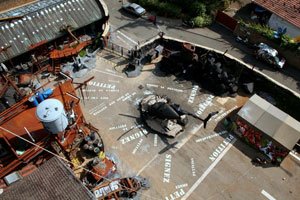
I give you...the Abode of Chaos
Crashed aircraft, fire-blackened walls, a swimming pool of blood and portraits
of Tony Blair and Osama bin Laden adorn a sprawling “shrine to chaos”
...
Demeure du Chaos (Abode of Chaos) includes a swimming pool of blood, top,
alongside a display of twisted metal, charred walls, burnt-out cars and
battlefield debris.
M Ehrmann’s celebration of the apocalypse, inspired
by his experiences in the Middle East and by the events of September 11, 2001,
has enraged residents, who are offended by its charred walls, twisted metal,
burnt-out cars and battlefield debris. A mock oil platform sits on one roof amid
camouflage netting. The garden includes a sculpture re-creating the remains of
the World Trade Centre.
“I have to pass by it every day. It’s morbid.
It’s horrible,” Monique Nietto, a neighbour, told Le Parisien. “M Ehrmann has
completely destroyed a magnificent property.”
The locals call the site “
Edward Tufte Lecture Notes
Edward Tufte Lecture 10/2/06: SG Notes
Presenting Data and Information
Use high-density data
· Allow audience to read. People can read 2-4 times faster than you can talk.
Minimize graphic flair
· Allows more space for explanatory material.
· Eliminate boxes on org charts when 2-D location of text already describes relationships inside organization
· Eliminate chartjunk (e.g., explosions; cf FEMA chart)
Annotate
· Explain what’s going on
Show causality
· Differentiate links/relationships
· Use whatever evidence is important
· Multiple levels of information in one exhibit
· Allow users to tell their own little stories
Presentation Methods
1. Don’t get it original, get it right
2. Model: NYT/WSJ
o News stories
o Sports page
o Weather page
o Stock page
3. This is a solved problem
4. NYT/WSJ are:
o High density
o Conventionally designed—designs that have worked
o Despite complexity of data, millions of people can read the sports page, get lots of information, so don’t underestimate the capability of your audience to understand
Two main problems in Information Display:
1. Multivariate problems
Subproblem: how to display in 2-D/ on paper
2. Information Resolution
Put your name on your work. Work is not done by organizations, it is done by people. Putting your name on it is a sign of pride in craftsmanship, and allows users to direct questions/criticisms back to the author.
Label data directly. Avoid legends & distant labels.
2-D workaround example: Euclid, 1st edition, 1570
· Use of 3-D popups, still functional in book copy almost 500 years later
The Grand Principles of Analytic Design
1. Use comparisons
Rulers, scale, normal ranges, etc
2. Show causality
3. Show many dimensions/levels of data
4. Completely integrate words, numbers and images
“The evidence is indifferent to the mode of production”
5. Document everything and tell people about it
This adds credibility and reasons to believe
Also enables further study
Show all of your data—don’t cherry pick
6. Content counts most of all
Serious presentations stand or fall on the quality, relevance and content of
information
7. Adjacent in space, not stacked in time
Don’t make users turn the page to see next result. It is easier to compare
adjacent things
8. Use small multiples (cf Galileo sunspot diagrams)
9. Put everything on a universal grid
How big is it?
Where is it?
What is its context?
These are the commonalities among all humans, regardless of time, culture
Low resolution of screens vs. paper
· Computer screen uses ~1/500th of human eye-brain capacity
· 1 glance = ~150Mb data
· 16 bit color (up to 20 bit for artists/designers)
· Paper 10-12 times better than screen for resolution
Aside: p.162 of Galileo’s Demonstrations features the only direct reference he made in print to the movement of the earth: “dal meuimento anno della Terra”. (“The annual movement of the Earth”) The church asked him not to repeat this.
Credibility:
You know what you’re talking about
You aren’t cherry picking
Give lots of handouts
· Lets people use their own cognitive style. People not paying attention to the speaker in order to read the handout is a sign the audience is awake
Respect the audience. Contempt leaks through.
To clarify, add detail
· Sounds paradoxical, but is true
To see best variation, scale average slope of data to 45°
· Avoids ceiling & floor effects
· Most useful for cyclic data; allows best detection of variation
· You want lumpy, not spiky or flat graphs
Use sparklines: intense, simple, word-sized graphics inline with text
· Software: Sparkline—shareware office plug-in
· Other software:
Stats program: SAS, SPSS, “anything that costs more than $500”
Design program: Illustrator
Page layout software
Resolution of words=Resolution of sparkline graphics
Usability tests: do people use something similar
John Tukey: “Better to be approximately right than exactly wrong”
Project management:
· Best to do wallchart
· Make it large, updated regularly
· Readable 2-3’ away
When reading a PPT presentation, ask:
· What’s the story?
· Does it establish credibility
· What’s the scope? Two problems:
o Overreaching
o Irrelevant Domain
PowerPoint Flaws:
· Low Resolution: 4 sheets of paper=50-250 PPT slides
· Chops all info into slide-sized pieces
· Encourages fake hierarchies (bullets)
· Encourages clipped jargon, non-English
· Discourages non-findings
· Encourages pitching, rather than reporting
Pitching out corrupts within (cf Iraq evidence)
Solution: use technical reports, built in word processor, instead of decks
Technical Report:
11”x17” paper, folded once, written on both sides
Start with 200 word intro:
What the problem is
Who cares (what’s the relevance)
What your solution is
Model is article in Science or Nature
Meant to be read through
High resolution data dump
Followed by discussion
If someone derails talk, at least you got through the 200 word summary
One handout means
50-250 slides of average density
1000-2000 words or
500-1000 sparklines
General presentations:
· Worry about content, rather than production values
· Practice, practice, practice
· Video of self reveals: verbal & gestural tics, placeholders, other annoying quirks
· Show up early
1 time in 20, this heads off a serious problem (double booking, etc)
1 time in 20, allows a quiet opportunity to prepare, talk to/greet audience
20 times in 20, you are not late
Presentation
Start with 200 word, 3 part summary from report
Never apologize (Don’t waste time talking about you, talk about the data)
For presenting complicated data/data display:
PGP=Particular, General, Particular
Give an example, then orient to whole of data, then give another specific example
Give everybody a piece of paper
Don’t condescend to your audience. Instead of “Knowing your audience,” which leads to underestimation: Respect your audience, Know your content.
Use body language
Finish early.
__________
Key readings:
The Visual Display of Quantitative Information, Introduction and Ch. 1
Envisioning Information, Introduction and Ch. 2
Beautiful Evidence, Introduction and pp. 12-45
Presenting Data and Information
Use high-density data
· Allow audience to read. People can read 2-4 times faster than you can talk.
Minimize graphic flair
· Allows more space for explanatory material.
· Eliminate boxes on org charts when 2-D location of text already describes relationships inside organization
· Eliminate chartjunk (e.g., explosions; cf FEMA chart)
Annotate
· Explain what’s going on
Show causality
· Differentiate links/relationships
· Use whatever evidence is important
· Multiple levels of information in one exhibit
· Allow users to tell their own little stories
Presentation Methods
1. Don’t get it original, get it right
2. Model: NYT/WSJ
o News stories
o Sports page
o Weather page
o Stock page
3. This is a solved problem
4. NYT/WSJ are:
o High density
o Conventionally designed—designs that have worked
o Despite complexity of data, millions of people can read the sports page, get lots of information, so don’t underestimate the capability of your audience to understand
Two main problems in Information Display:
1. Multivariate problems
Subproblem: how to display in 2-D/ on paper
2. Information Resolution
Put your name on your work. Work is not done by organizations, it is done by people. Putting your name on it is a sign of pride in craftsmanship, and allows users to direct questions/criticisms back to the author.
Label data directly. Avoid legends & distant labels.
2-D workaround example: Euclid, 1st edition, 1570
· Use of 3-D popups, still functional in book copy almost 500 years later
The Grand Principles of Analytic Design
1. Use comparisons
Rulers, scale, normal ranges, etc
2. Show causality
3. Show many dimensions/levels of data
4. Completely integrate words, numbers and images
“The evidence is indifferent to the mode of production”
5. Document everything and tell people about it
This adds credibility and reasons to believe
Also enables further study
Show all of your data—don’t cherry pick
6. Content counts most of all
Serious presentations stand or fall on the quality, relevance and content of
information
7. Adjacent in space, not stacked in time
Don’t make users turn the page to see next result. It is easier to compare
adjacent things
8. Use small multiples (cf Galileo sunspot diagrams)
9. Put everything on a universal grid
How big is it?
Where is it?
What is its context?
These are the commonalities among all humans, regardless of time, culture
Low resolution of screens vs. paper
· Computer screen uses ~1/500th of human eye-brain capacity
· 1 glance = ~150Mb data
· 16 bit color (up to 20 bit for artists/designers)
· Paper 10-12 times better than screen for resolution
Aside: p.162 of Galileo’s Demonstrations features the only direct reference he made in print to the movement of the earth: “dal meuimento anno della Terra”. (“The annual movement of the Earth”) The church asked him not to repeat this.
Credibility:
You know what you’re talking about
You aren’t cherry picking
Give lots of handouts
· Lets people use their own cognitive style. People not paying attention to the speaker in order to read the handout is a sign the audience is awake
Respect the audience. Contempt leaks through.
To clarify, add detail
· Sounds paradoxical, but is true
To see best variation, scale average slope of data to 45°
· Avoids ceiling & floor effects
· Most useful for cyclic data; allows best detection of variation
· You want lumpy, not spiky or flat graphs
Use sparklines: intense, simple, word-sized graphics inline with text
· Software: Sparkline—shareware office plug-in
· Other software:
Stats program: SAS, SPSS, “anything that costs more than $500”
Design program: Illustrator
Page layout software
Resolution of words=Resolution of sparkline graphics
Usability tests: do people use something similar
John Tukey: “Better to be approximately right than exactly wrong”
Project management:
· Best to do wallchart
· Make it large, updated regularly
· Readable 2-3’ away
When reading a PPT presentation, ask:
· What’s the story?
· Does it establish credibility
· What’s the scope? Two problems:
o Overreaching
o Irrelevant Domain
PowerPoint Flaws:
· Low Resolution: 4 sheets of paper=50-250 PPT slides
· Chops all info into slide-sized pieces
· Encourages fake hierarchies (bullets)
· Encourages clipped jargon, non-English
· Discourages non-findings
· Encourages pitching, rather than reporting
Pitching out corrupts within (cf Iraq evidence)
Solution: use technical reports, built in word processor, instead of decks
Technical Report:
11”x17” paper, folded once, written on both sides
Start with 200 word intro:
What the problem is
Who cares (what’s the relevance)
What your solution is
Model is article in Science or Nature
Meant to be read through
High resolution data dump
Followed by discussion
If someone derails talk, at least you got through the 200 word summary
One handout means
50-250 slides of average density
1000-2000 words or
500-1000 sparklines
General presentations:
· Worry about content, rather than production values
· Practice, practice, practice
· Video of self reveals: verbal & gestural tics, placeholders, other annoying quirks
· Show up early
1 time in 20, this heads off a serious problem (double booking, etc)
1 time in 20, allows a quiet opportunity to prepare, talk to/greet audience
20 times in 20, you are not late
Presentation
Start with 200 word, 3 part summary from report
Never apologize (Don’t waste time talking about you, talk about the data)
For presenting complicated data/data display:
PGP=Particular, General, Particular
Give an example, then orient to whole of data, then give another specific example
Give everybody a piece of paper
Don’t condescend to your audience. Instead of “Knowing your audience,” which leads to underestimation: Respect your audience, Know your content.
Use body language
Finish early.
__________
Key readings:
The Visual Display of Quantitative Information, Introduction and Ch. 1
Envisioning Information, Introduction and Ch. 2
Beautiful Evidence, Introduction and pp. 12-45
Monday, September 11, 2006
Thursday, September 07, 2006
Hey Ya!
The sad but inevitable sound of summer receding. Magical and true.
Obadiah Parker covering Outkast's Hey Ya!
audio version
via Jonathan Carroll
Obadiah Parker covering Outkast's Hey Ya!
audio version
via Jonathan Carroll
Monday, September 04, 2006
Leverage: My Hero
Guy Gabaldon, died at age 80 this week.
He grew up as part of a "multiethnic gang", moved in with a Japanese-American family subsequently interned in Alaska, and fought in WWII. Using a mixture of rudimentary Japanese and cigarettes, he successfully captured over 1,500 Japanese soldiers on the island of Saipan, earning himself the nickname of "Pied Piper" and winning a Navy Cross Medal in the process.
(Wikipedia Entry)
He grew up as part of a "multiethnic gang", moved in with a Japanese-American family subsequently interned in Alaska, and fought in WWII. Using a mixture of rudimentary Japanese and cigarettes, he successfully captured over 1,500 Japanese soldiers on the island of Saipan, earning himself the nickname of "Pied Piper" and winning a Navy Cross Medal in the process.
(Wikipedia Entry)
Subscribe to:
Posts (Atom)